Github Repo: LA-Web-Traffic-Analysis
Python Script: webtraffic.ipynb
Tableau Dashboard: Tableau Software LAcity.org Web Traffic
Table of Contents
Project Overview
This analysis examines the web traffic information of lacity.gov, the official website of the City of Los Angeles, from the years 2014 to 2019. The dataset is made up of over 8 million records and contains valuable data concerning user behavior and trends in engagement as well as devices’ used. The goal was to produce specific guidelines that increase user engagement, streamline site efficiency, and enhance communication and in particular during events such as natural disasters such a thing is highly necessary.
As the site is vital to enabling residents to receive current information and services, understanding user habits is vital for better access, interaction, and preparedness during crises.
I cleaned and augmented the dataset by standardizing column names to
snake_caseand converting the date column to datetime, removing timestamps. I revieweddevice_categoryand cleaned thebrowsercolumn by stripping whitespace, applying.title(), and grouping similar or inconsistent entries using a mapping for clarity and consistency. Replaced placeholders with NaN, filled missing browsers as"Unknown", and removed duplicate rows to ensure clean, accurate data. Cleaning Script here.
Key Definitions:
- Sessions: A visit to the website where everything a user does during that session has been registered.
- Bounce Rate: The number of sessions in which users arrived at the site and then left in the clicking of a button without further session activity.
- Device Categories: The various devices used by the users particularly, desktop, mobile and tablet.
Executive Summary
Using a dataset of over 8 million web sessions, this analysis explores trends for bounce rate, device utilized and total visits to the website between 2014 and 2019. SQL was used on the data and a Tableau dashboard was built to represent important metrics in graphics.
Below is an overview page from Tableau Dashboard.The entire interactive dashboard can be found here.
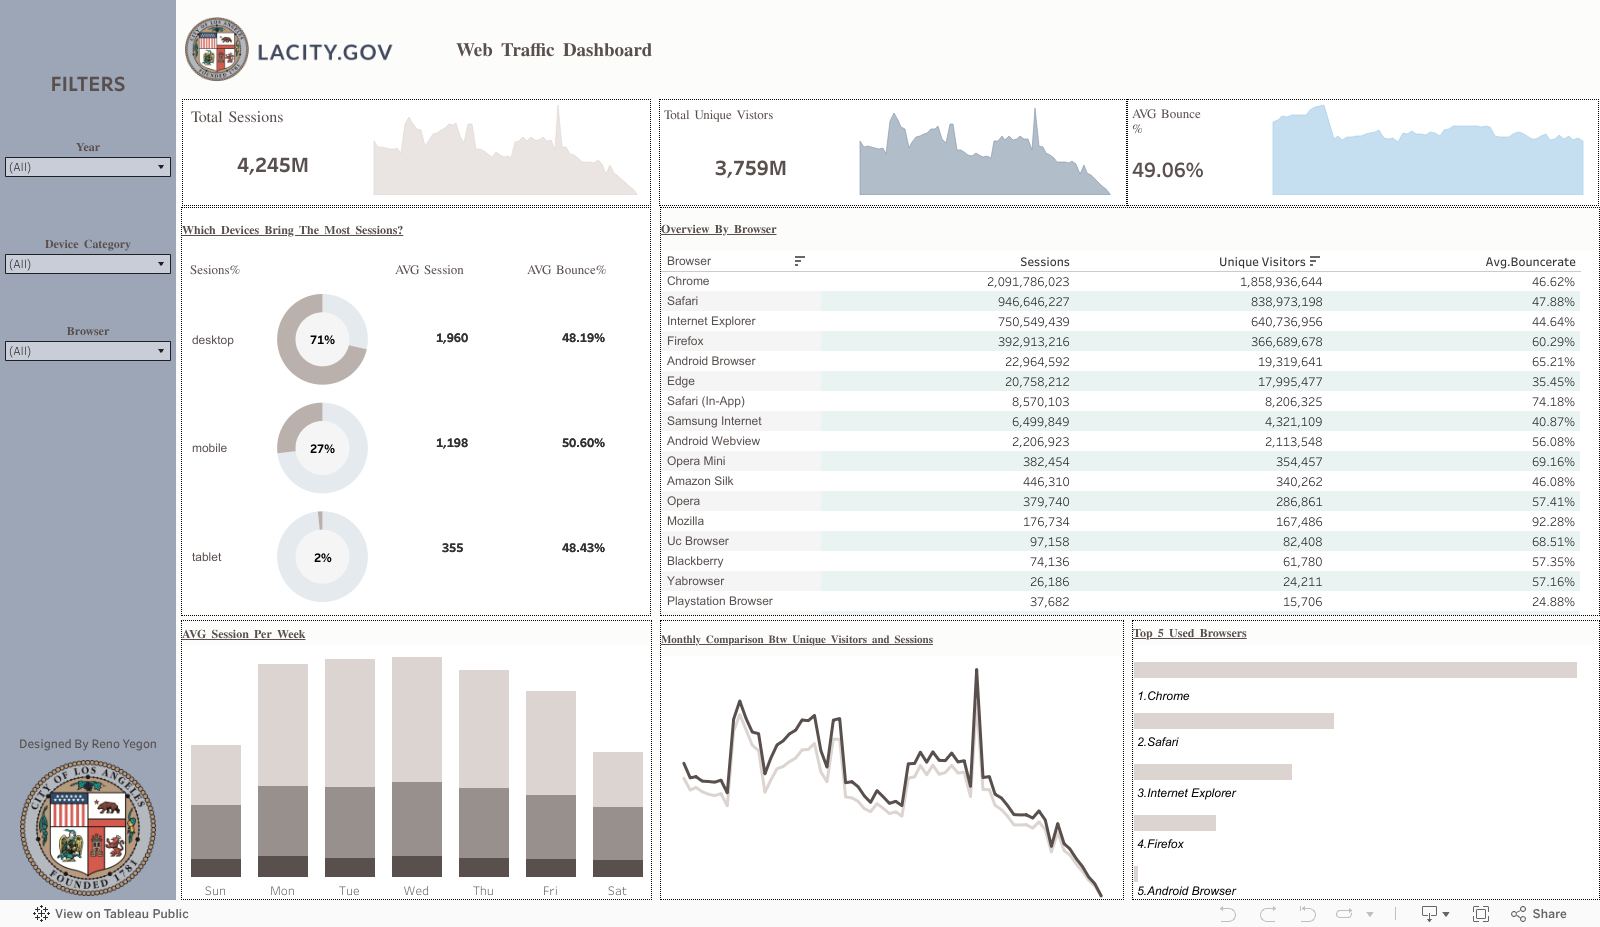
Findings Indicate:
- Desktops are still the main device used as 71.49% drive the sessions.
- Mobile devices are second in usage but have the highest bounce rate, numbers are approximately 2.41% higher than desktops.
- Tablets have the smallest number of traffic but have somewhat better bounce rate than desktop.
Usually, the weekdays traffic is higher than weekends and a notable increase in the December 2017, probably due to the California wildfires, highlight the trust in the site during incidences of urgency. However, it is important to note that an obvious reduction in traffic from the year 2017 to the year 2019 is the subject for further analysis.
Detailed Insights
- Device Usage:
- Desktop: brings in the most sessions (72% of the total).
- Mobile: ranks second but has the highest bounce rate (~3% higher than desktop).
- Tablet: bring in the least amount of traffic, though they have a lower bounce rate compared to mobile.
- Browser Patterns:
- Chrome: On desktop, Chrome is the most-used browser.
- On mobile and tablet, Safari dominates the sessions.
- The default mobile browsers (Safari in-app and Android Browser) tend to have higher bounce rates, contributing to mobile’s higher overall bounce rate.
- Traffic Trends:
- Weekdays see significantly higher traffic compared to weekends.
- There is a notable traffic spike in December 2017, which correlates with multiple wildfires that occurred in California during that time. The spike suggests the website was used as a key information hub during that crisis.
- A steady decline in traffic from 2017 to 2019 was observed, indicating a need to investigate factors behind this trend.
Recommendations
Findings and recommendations are intended to be shared with key stakeholders including the IT, Marketing, and Web Development teams to guide data-driven improvements across.
- Crisis Communication Strategy: Improve mobile access and interface to facilitate an efficient flow of important messages during emergencies taking advantage of increased mobile traffic at such times.
- Focus Weekday Engagement: Suggest updates and go on marketing runs during weekdays, working with the most popular user engagement hours. Process maintenance and performance upgrades at calmer weekend periods to reduce inconveniences to users.
- Mobile Optimization: Optimize the presentation of content and way of accessing it on mobile platforms so that the number of visitors who quickly leave the site gets reduced. Simplify the process by collecting and applying input from users in designing.
- Desktop Experience Maintenance: Deliver outstanding performance and browser compatibility in desktop platforms with a strong focus on how Chrome browser performs.
- Investigate Traffic Decline: Participate in surveys and research undertakings to get enlightenment on the drivers of the downward trend in traffic from 2017-2019. This method will allow us to identify usability problems or content inadequacies or changes in the needs for public information.
Assumptions and Caveats
- The higher amount of traffic seen on the web during the month of December 2017 is believed to be attributed to wildfires, although several other causes are also possible.
- Data up until 2019 has been included in the analysis. Subsequent trends are not reflected.
- Bounce rate measurement is based on available session data that may not entirely track every user’s engagement.
Technical Project Information
The Original dataset gives records for unique visitors, sessions, and bounce rates on the lacity.gov site (from 2014 to 2019).
The data was cleaned and transformed using Python. You can find the transformation script here.
Visualizations created in Tableau may be checked out on the LAcity.org Web Traffic Dashboard.